What This Deck Covers
- 01 Microsoft Ads: Executive Summary
- 02 The Scaling Challenge
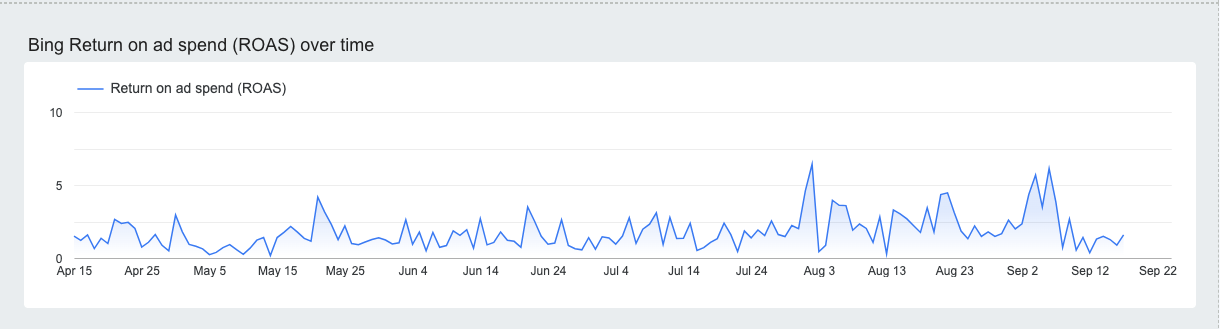
- 03 Weekly ROAS Progression
- 04 Campaign Breakdown
- 05 Reddit Ads: Executive Summary
- 06 Campaign Testing Matrix
- 07 Weekly Performance Progression
- 08 Key Takeaways
Microsoft Ads launched as a supplementary search channel to capture users outside the Google ecosystem. The platform initially struggled with spend pacing, then overscaled, and has since been optimized into a consistent performer.
Microsoft Ads presented a unique challenge: the platform initially struggled to spend at all. Through targeting adjustments and campaign expansion, we got the spend flowing. But pushing too hard too fast in May caused ROAS to crater. The recovery phase required systematic campaign pruning and bid optimization.
In the week of May 4, spend peaked at $8,810 ($1,259/day) while ROAS dropped to 0.51x. Daily spend was nearly 3x the April average. We immediately pulled back, cutting underperforming campaigns and refocusing budget on proven converters. By the week of May 18, ROAS had already recovered to 2.04x.
| Week | Spend | Revenue | ROAS | Conv | CPA |
|---|---|---|---|---|---|
| Phase 1 Ramp-Up (April) | |||||
| Apr 6 | $1,461 | $5,057 | 3.46x | 44 | $33.20 |
| Apr 13 | $3,430 | $5,405 | 1.58x | 44 | $77.95 |
| Apr 20 | $4,359 | $6,683 | 1.53x | 65 | $67.07 |
| Apr 27 | $7,305 | $8,524 | 1.17x | 76 | $96.12 |
| Phase 2 Overscaling & Correction (May) | |||||
| May 4 | $8,810 | $4,474 | 0.51x | 45 | $195.77 |
| May 11 | $4,466 | $5,126 | 1.15x | 44 | $101.50 |
| May 18 | $3,702 | $7,543 | 2.04x | 53 | $69.85 |
| May 25 | $5,166 | $6,855 | 1.33x | 70 | $73.80 |
| Phase 3 Optimization & Consistency (June onwards) | |||||
| Jun 1 | $2,624 | $3,579 | 1.36x | 35 | $74.96 |
| Jun 8 | $3,181 | $4,786 | 1.50x | 39 | $81.56 |
| Jun 15 | $3,701 | $5,202 | 1.41x | 43 | $86.07 |
| Jun 22 | $3,478 | $4,909 | 1.41x | 54 | $64.40 |
| Jun 29 | $3,011 | $3,440 | 1.14x | 36 | $83.63 |
| Jul 6 | $2,936 | $6,131 | 2.09x | 52 | $56.47 |
| Jul 13 | $3,512 | $4,514 | 1.29x | 50 | $70.24 |
| Jul 20 | $2,832 | $4,525 | 1.60x | 45 | $62.94 |
| Jul 27 | $2,262 | $5,032 | 2.22x | 56 | $40.40 |
| Aug 3 | $1,821 | $3,737 | 2.05x | 38 | $47.91 |
| Aug 10 | $2,453 | $4,833 | 1.97x | 49 | $50.06 |
| Aug 17 | $2,232 | $4,740 | 2.12x | 47 | $47.49 |
| Aug 24 | $2,173 | $2,777 | 1.28x | 27 | $80.47 |
| Campaign | Spend | Revenue | ROAS | Conv |
|---|---|---|---|---|
| Shopping | Shampoo & Conditioners | $1,972 | $5,839 | 2.96x | 64 |
| Shopping || All Products | $5,946 | $13,853 | 2.33x | 129 |
| Branded Search USA | $17,240 | $36,011 | 2.09x | 329 |
| US_Full_C_Combo_PMAX-BR-Products | $15,675 | $25,876 | 1.65x | 247 |
| Summer Sale | PMax | $1,219 | $1,911 | 1.57x | 17 |
| Search | 04-28-2026 | $7,268 | $9,970 | 1.37x | 98 |
| Subscription | PMax | $2,008 | $2,015 | 1.00x | 19 |
| Performance Max | Lash & Brow | $4,629 | $3,550 | 0.77x | 30 |
| Search | Hair Growth Solutions | $8,153 | $5,630 | 0.69x | 53 |
| Branded Search USA #2 | $5,019 | $786 | 0.16x | 8 |
| Search | Competitor Conquesting | $1,119 | $0 | 0.00x | 0 |
| Search | Problem-Aware | $1,022 | $0 | 0.00x | 0 |
Competitor Conquesting and Problem-Aware Search generated $2,141 in combined spend with zero revenue. Branded Search USA #2 (a variant test) returned only 0.16x ROAS vs. the original at 2.09x. These were paused or sunset, and budget was reallocated toward Shopping and the primary Branded Search campaign, which consistently delivered 2x+ returns.
Reddit was introduced as a testing platform to reach a highly engaged, research-driven audience. Unlike traditional search or social platforms, Reddit users are known for browsing, researching, and then converting later through other channels. This makes view-through conversions the key metric on Reddit, not click-through conversions.
Reddit users typically do not click ads and convert immediately. They see an ad, leave, research the product independently, and purchase later through direct search or organic channels. This behavior is captured through view-through conversions. A low CTR on Reddit does not indicate poor performance; it reflects the platform's native user behavior.
We launched campaigns across different product categories to identify which resonated most with Reddit's audience. After collecting data, we systematically paused underperformers and consolidated budget into the strongest campaign.
The first three campaigns (GRO Shampoo, Supplements, Lash Serum) launched June 18 as broad tests. In August, we added two more campaigns (Hair Serum, Hair Serum for Men) and the eventual winner, Lash & Brow. After analyzing view-through conversion data, we paused all five underperformers and isolated budget on Lash & Brow, which delivered 400%+ view-through ROAS.
| Week | Spend | Clicks | Impressions | CPC | CTR |
|---|---|---|---|---|---|
| Testing Broad campaign testing (July) | |||||
| Jul 14 | $871 | 601 | 99,030 | $1.45 | 0.61% |
| Jul 21 | $1,110 | 713 | 133,862 | $1.56 | 0.53% |
| Jul 28 | $1,224 | 720 | 155,052 | $1.70 | 0.46% |
| Pruning Pausing underperformers, adding new tests (August) | |||||
| Aug 4 | $545 | 242 | 65,666 | $2.25 | 0.37% |
| Aug 11 | $782 | 231 | 81,456 | $3.38 | 0.28% |
| Aug 18 | $955 | 291 | 102,930 | $3.28 | 0.28% |
| Aug 25 | $951 | 250 | 103,527 | $3.80 | 0.24% |
| Winner Lash & Brow isolated, 400%+ ROAS (September) | |||||
| Sep 1 | $955 | 251 | 99,162 | $3.80 | 0.25% |
| Sep 8 | $668 | 174 | 63,569 | $3.84 | 0.27% |
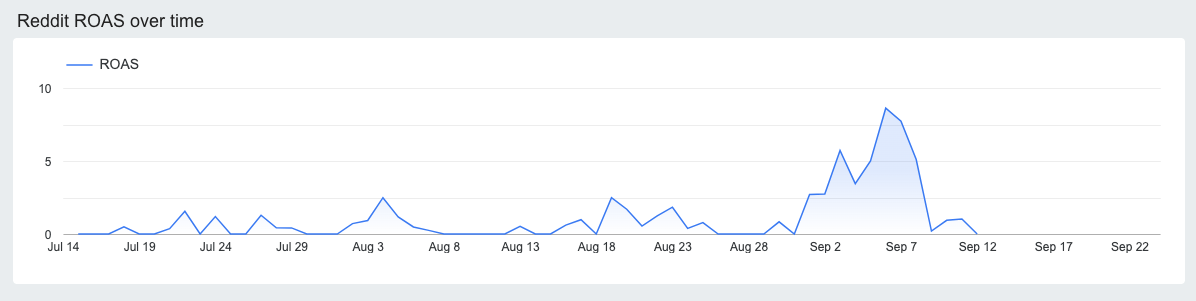
CTR dropped from 0.61% to 0.27% as we transitioned from Clicks-objective campaigns (which optimize for clicks) to Conversions-objective campaigns (which optimize for purchases). The lower CTR with higher CPC reflects a more qualified, purchase-intent audience. The view-through ROAS increasing to 400%+ confirms this strategy worked: fewer clicks, but the right clicks.
Both platforms followed the same optimization framework:
| Phase | Microsoft Ads | Reddit Ads |
|---|---|---|
| Launch | Cast wide, test campaign types | Launch 6 campaigns across product lines |
| Learn | Overscaling crash revealed weak campaigns | View-through data identified Lash & Brow as winner |
| Optimize | Cut losers, focus on Shopping + Branded (2x+ ROAS) | Paused 5 campaigns, isolated winner at 400%+ ROAS |